BT
Challenge
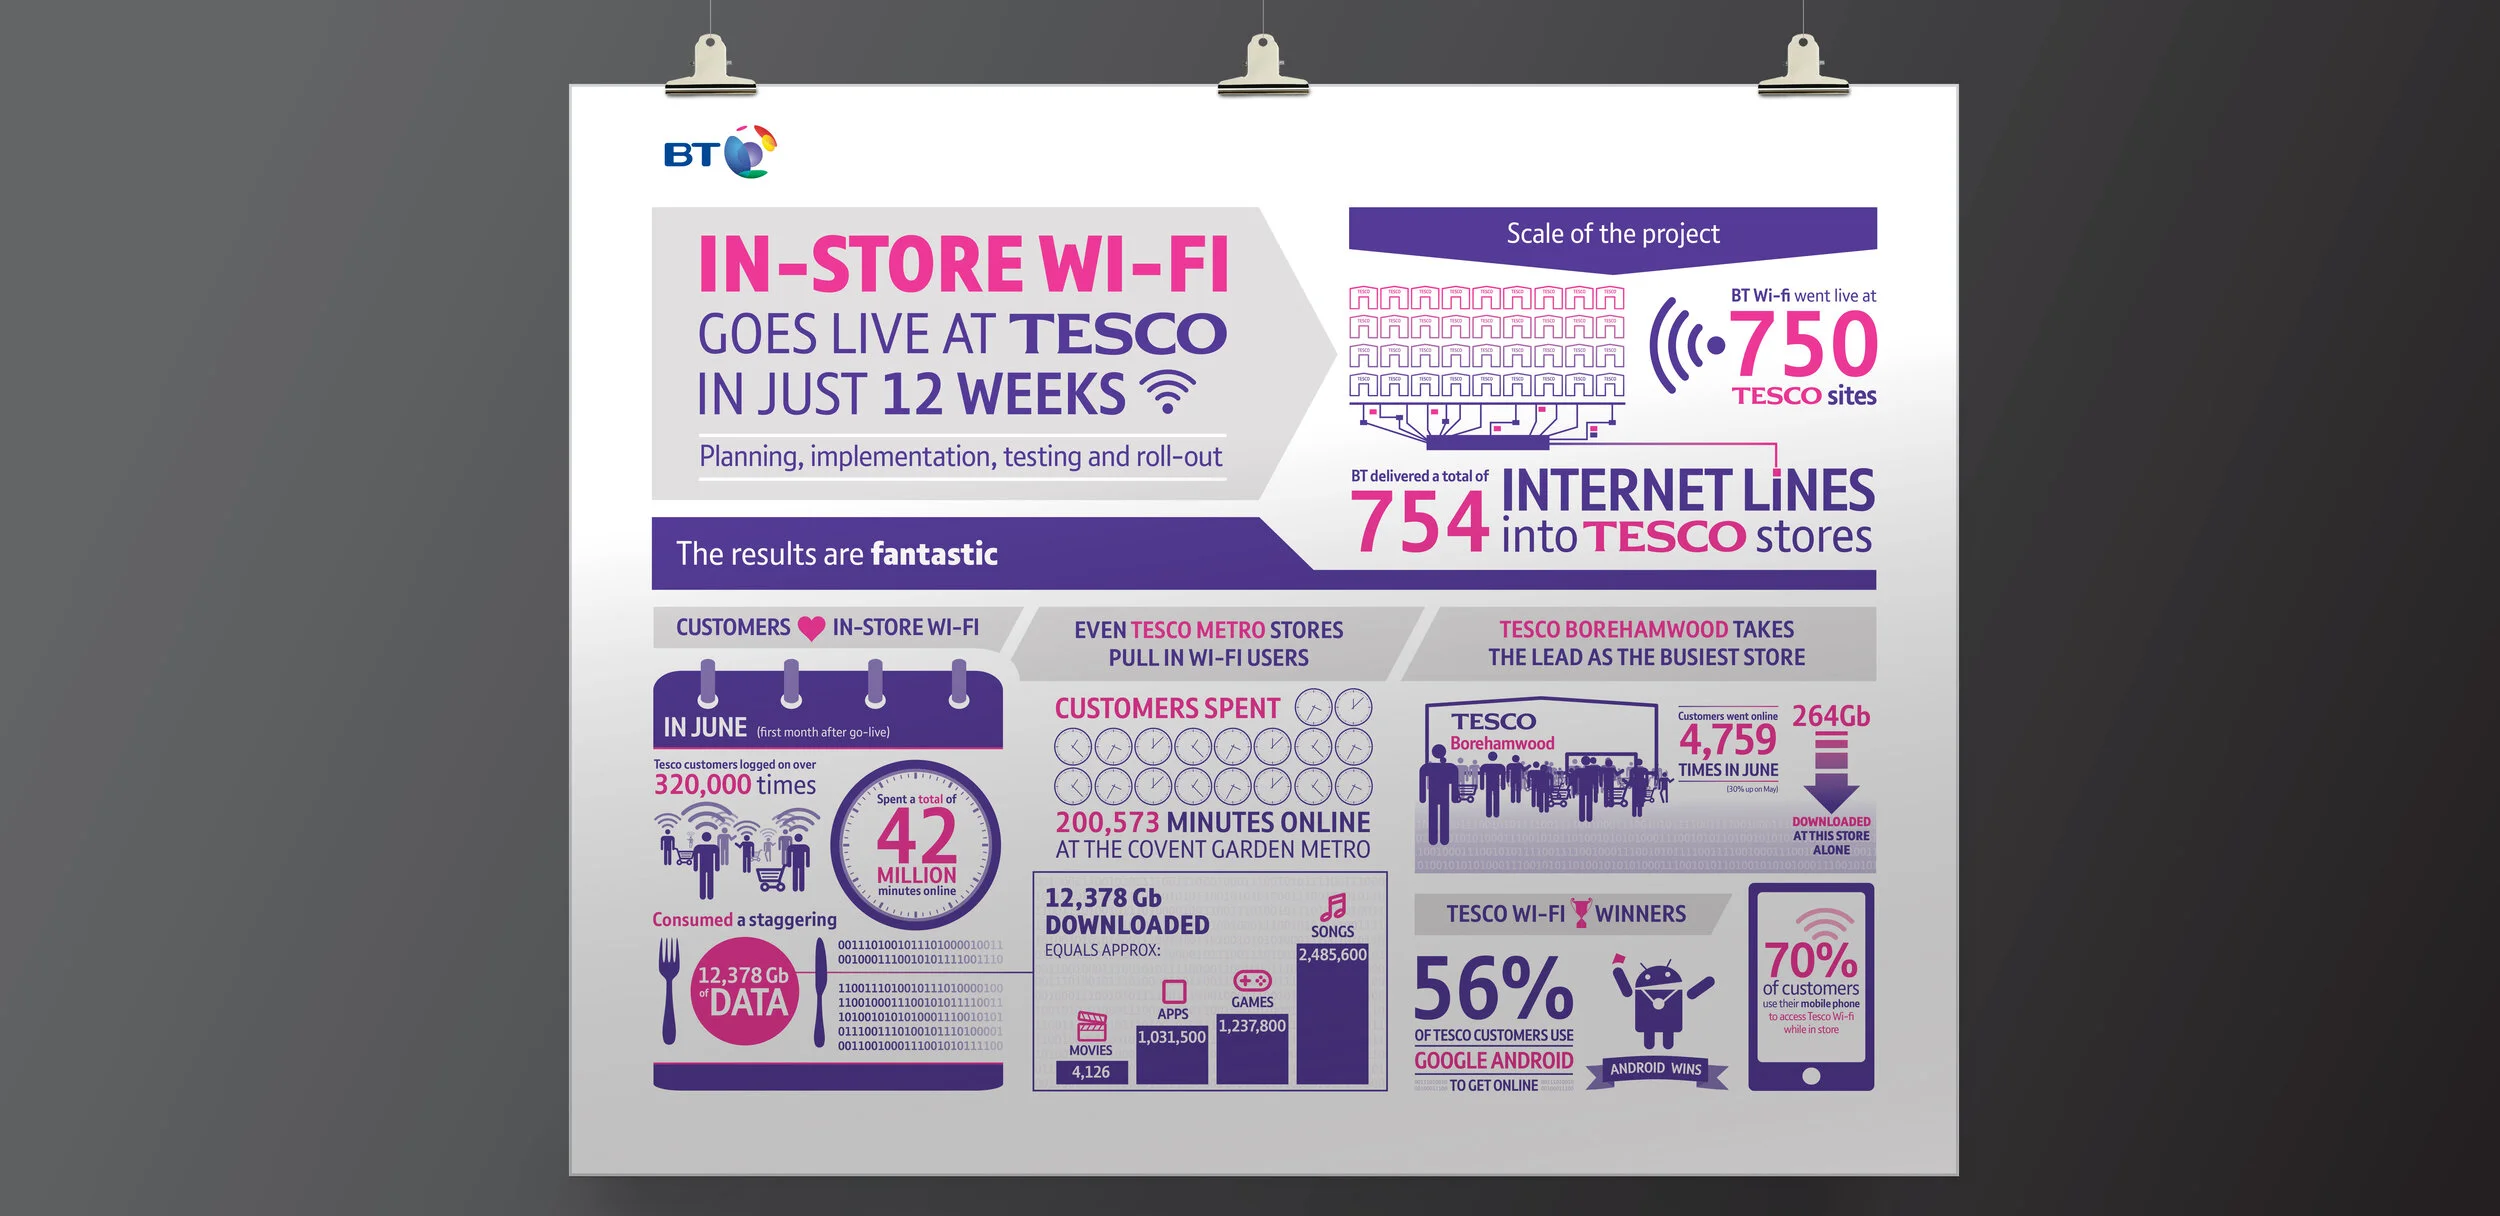
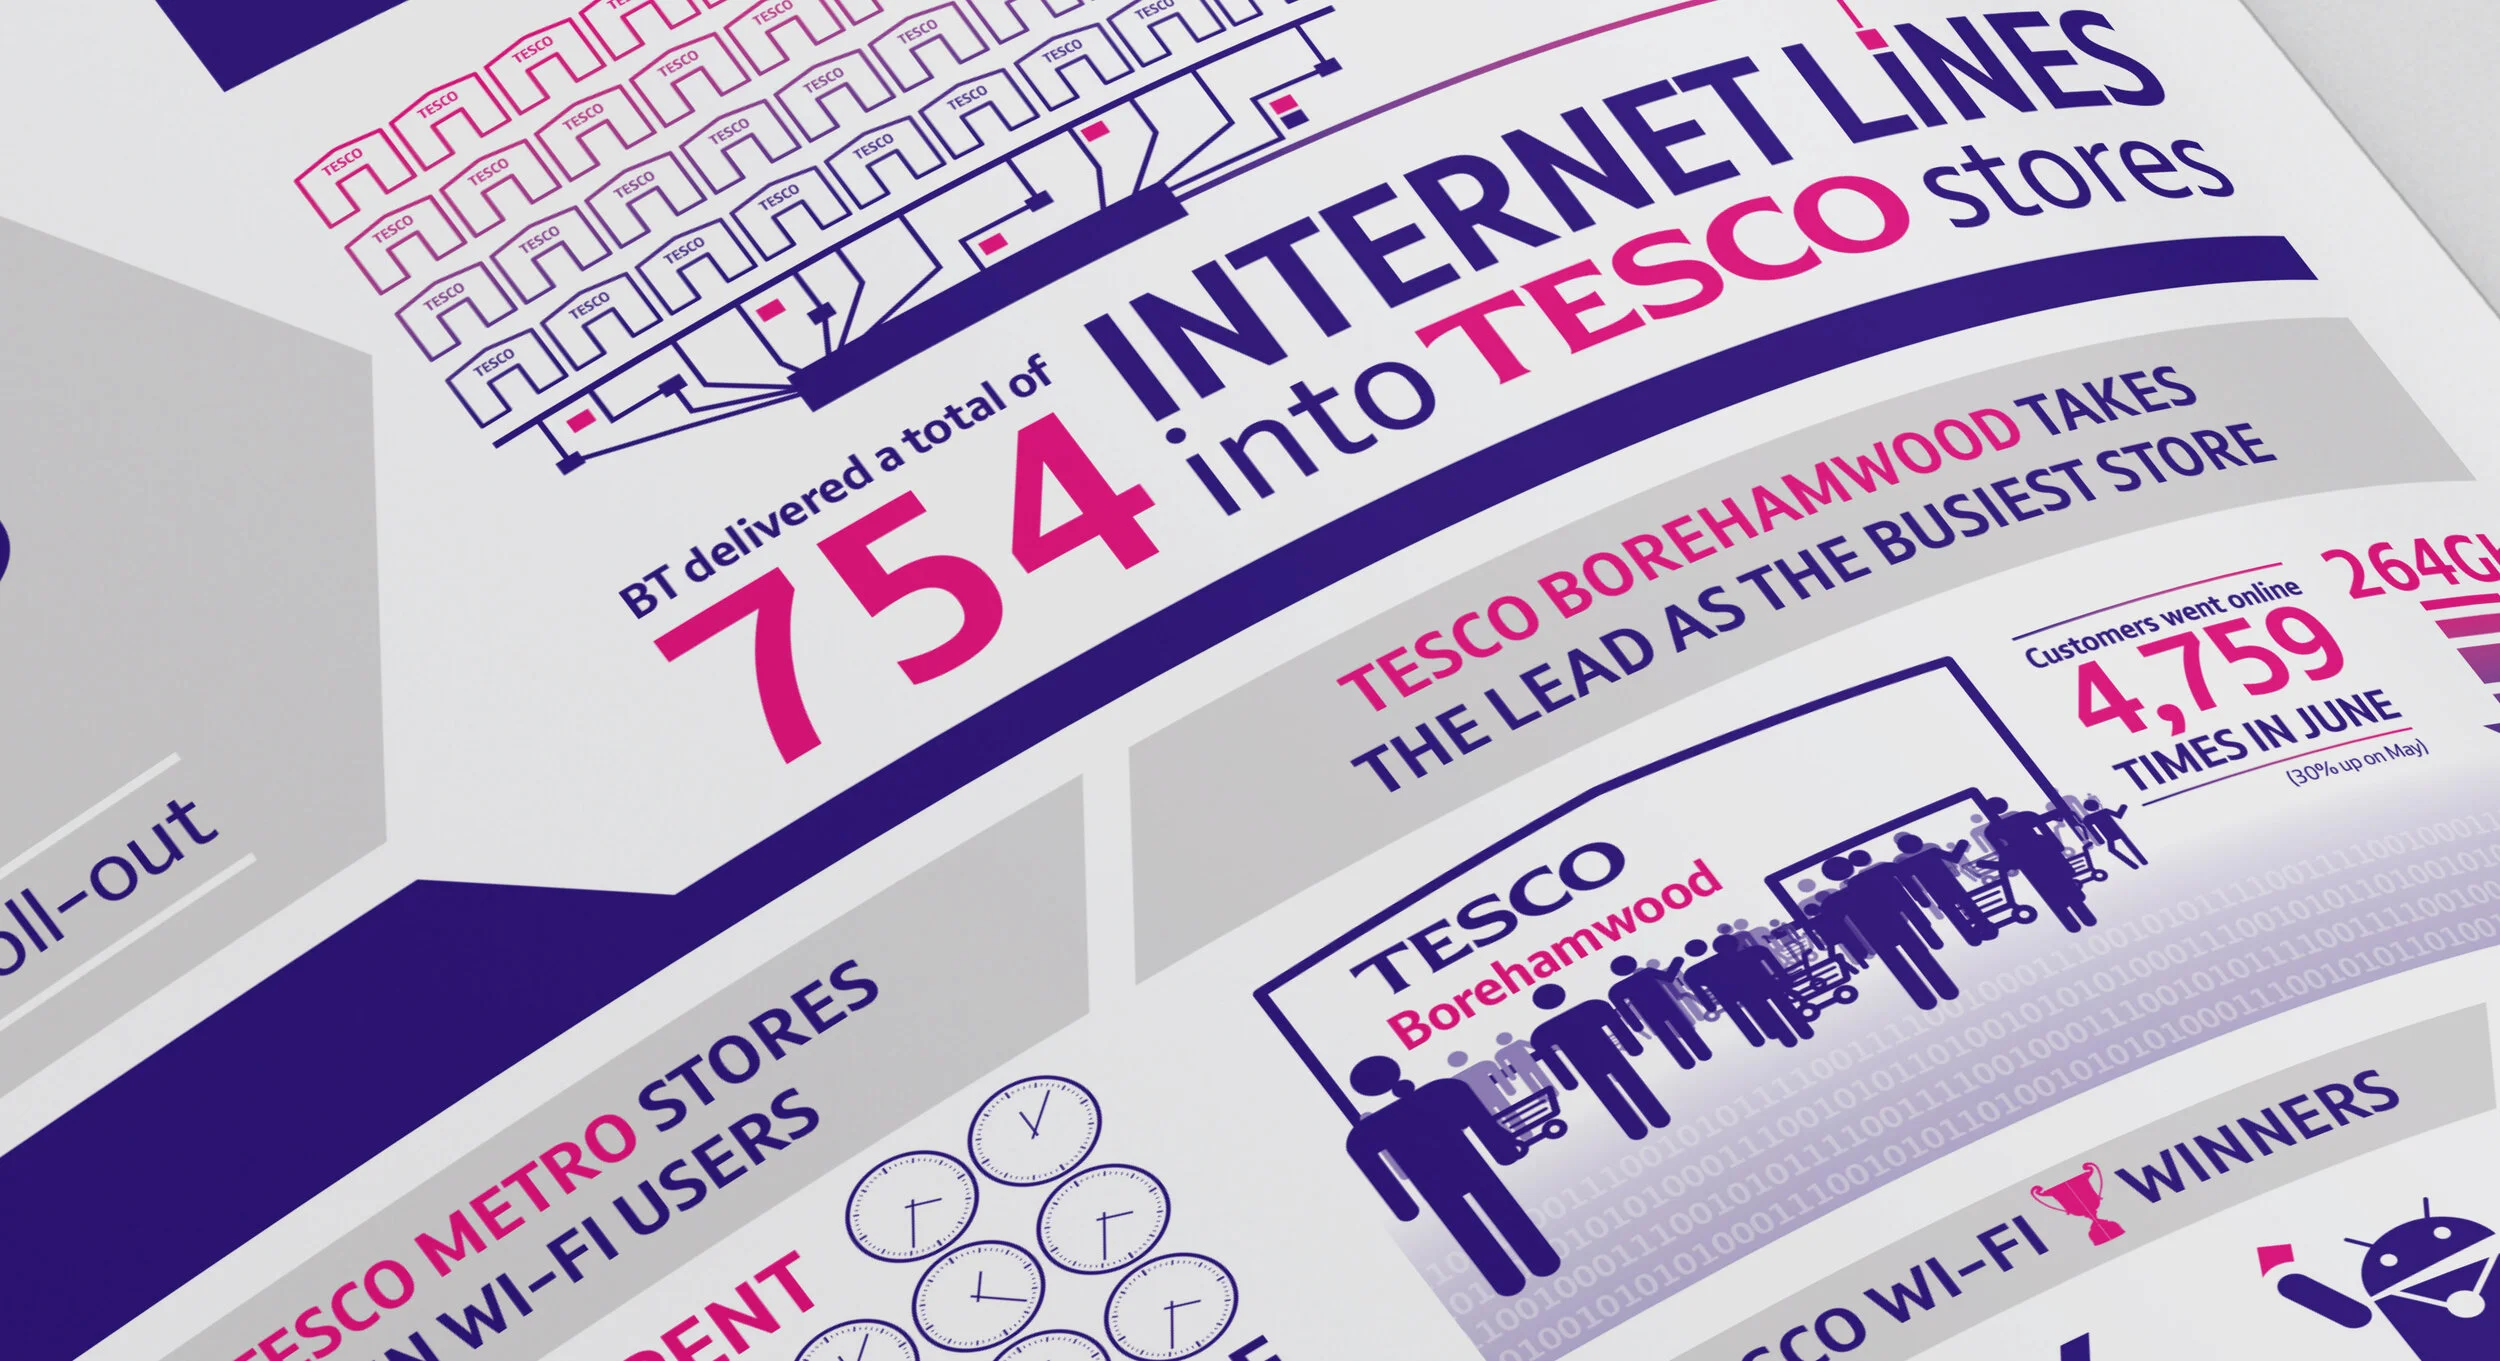
BT needed a consistent and engaging method for visually representing data-heavy information across various projects, such as their Wi-Fi statistics within Tesco. They sought a brand-aligned approach to data visualisation that could be used for both print and digital displays.
Solution
To make complex data more accessible and engaging, I developed a brand style of infographics designed to present statistics in a playful and visually appealing manner. This approach is adaptable for use across posters, displays, and digital devices.